Home Price Valuation
The Home Equity Calculator and Home Value Risk Analysis tools provide a quick independent assessment of the current value of a home, based on its previous sale price, previous sale data, and zip code.
The Home Equity Calculator is used to help pre-screen customers interested in opening a HELOC or home equity loan. The Home Value Risk Analysis monitors the collateral risk and is used to underwrite new loans.
Local Investment Ratings
We calculate a Score and assign a Rating for the risk of investing in real estate or mortgages in local markets, based on five economic factors: population growth; job growth; unemployment; changes in home prices; and whether the market is over-priced.
| The Ratings are: | Dangerous | Score: Under 0 |
| | Speculative | Score: 0 to 3 |
| | Medium Risk | Score: 3.1 to 6.0 |
| | Low Risk | Score: Over 6 |
Historically, mortgages written in Dangerous periods have had high default rates.
The Ratings help investors choose the level of risk they prefer, keeping in mind that returns can be higher in riskier markets.
Mortgage Portfolio Valuation
Clients can calculate the current and forecasted value of the homes in their portfolio with a spreadsheet containing the previous sale price, previous sale date, and zip code for each home. The Portfolio Management tool also returns results for the current, forecasted and cumulative LTV.
Mortgage Portfolio Stress Test
Clients can calculate the future value of all the homes in their portfolio under three different scenarios: Most Likely, Pessimistic, and Stress Test. These scenarios correspond to the future economic circumstances that will affect home prices, including the general economic situation and the demand for housing. The Most Likely scenario is the one we use for our regular home price forecast. The Pessimistic scenario assumes a worse economic and demand picture, and the Stress Test scenario assumes the worst possible conditions.
Home Price Forecasts
We forecast home prices in 316 local markets over the next 12, 24 and 36 months. Our forecast is based on the observation that changes in prices are caused both by economic forces and a predictable cycle related to the inefficiency of price adjustments.
Rent Forecasts
We monitor rents in 316 local markets using the American Community Survey data collected by the Census Bureau. Because the data are at least a year old when reported, we estimate current rents using a very accurate model that links rents to local income and home prices. This model also allows us to forecast rents 12, 24, and 36 months into the future.
Local Cap Rates
We calculate cap rates in 316 local markets to allow investors to calculate the value of a rental property. Our cap rates take into account a national cap rate component based on interest rates for mortgages and BAA corporate bonds, and a local risk premium that reflects the market imbalance between rents and home prices, the risk of falling home values in the next five years, and the risk of not finding suitable renters as seen in unemployment rates.
Income-Equivalent Home Price
The Income-Equivalent Home Price for a local market is where the average price would be if there were no distortions in the local market, such as speculation, asymmetrical income growth [windfalls for a small segment of the population], or mismatches between population growth and new home construction.
Although average prices are sometimes lower than the Income-Equivalent Home Price, markets are typically out of balance on the high side. The extent to which actual prices are higher than the Income-Equivalent Home Price is a measure of how much adjustment will eventually take place and a measure of the risk that actual home prices will fall.
In all unbalanced markets we have examined over the previous several decades, actual home prices always eventually return to the Income-Equivalent Home Price, although the adjustment process usually requires several years.
Local Market Reviews
All of our data and analyses are summarized in our Reviews for 316 local markets, mainly in the form of well-designed charts that show current and historical values. The Reviews are updated as new data are available, monthly and quarterly.
 View a sample Market Review.
Business Growth Report
Business Growth Reports for the first time let you see the detailed current business structure and dynamics of your local market,
to help you plan your sales and marketing efforts.
They show you the size of about 100 local business sectors, so you have accurate knowledge of the business environment you're working in.
They show you which business sectors are growing - and which ones aren't, so you know where to put your resources to work.
And they show you which banking products are most important to each business sector, so you can respond most effectively to the needs of new customers.
Business Growth Reports are updated every quarter with highly reliable data from the Bureau of Labor Statistics, the only source for this level of business detail.
Track the dynamics of your market - even down to the county level. See trends before they're obvious, spot new business sectors that need your services. Advise your customers about their own marketing plans.
Download a sample Business Growth Report.
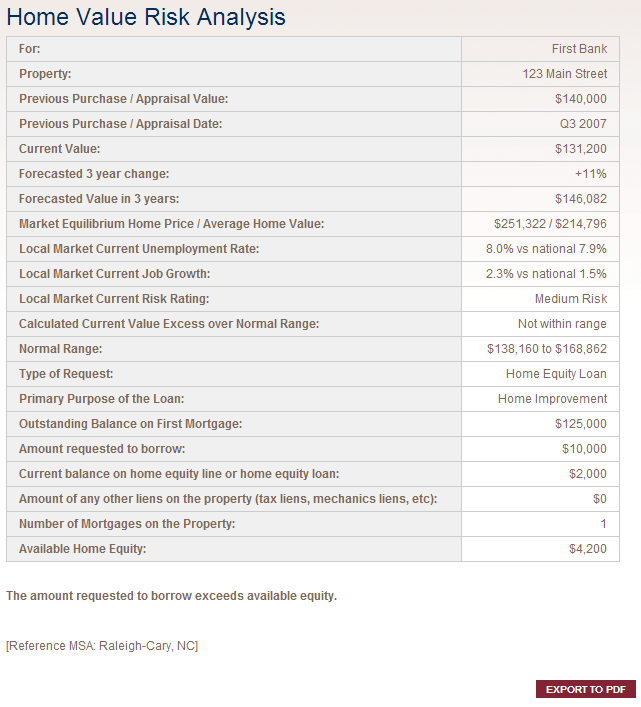 View a screenshot of the Underwriting Tool output
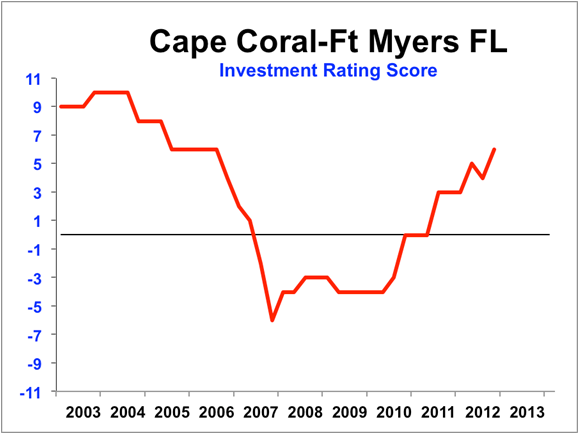 View an Investment Rating Score graph
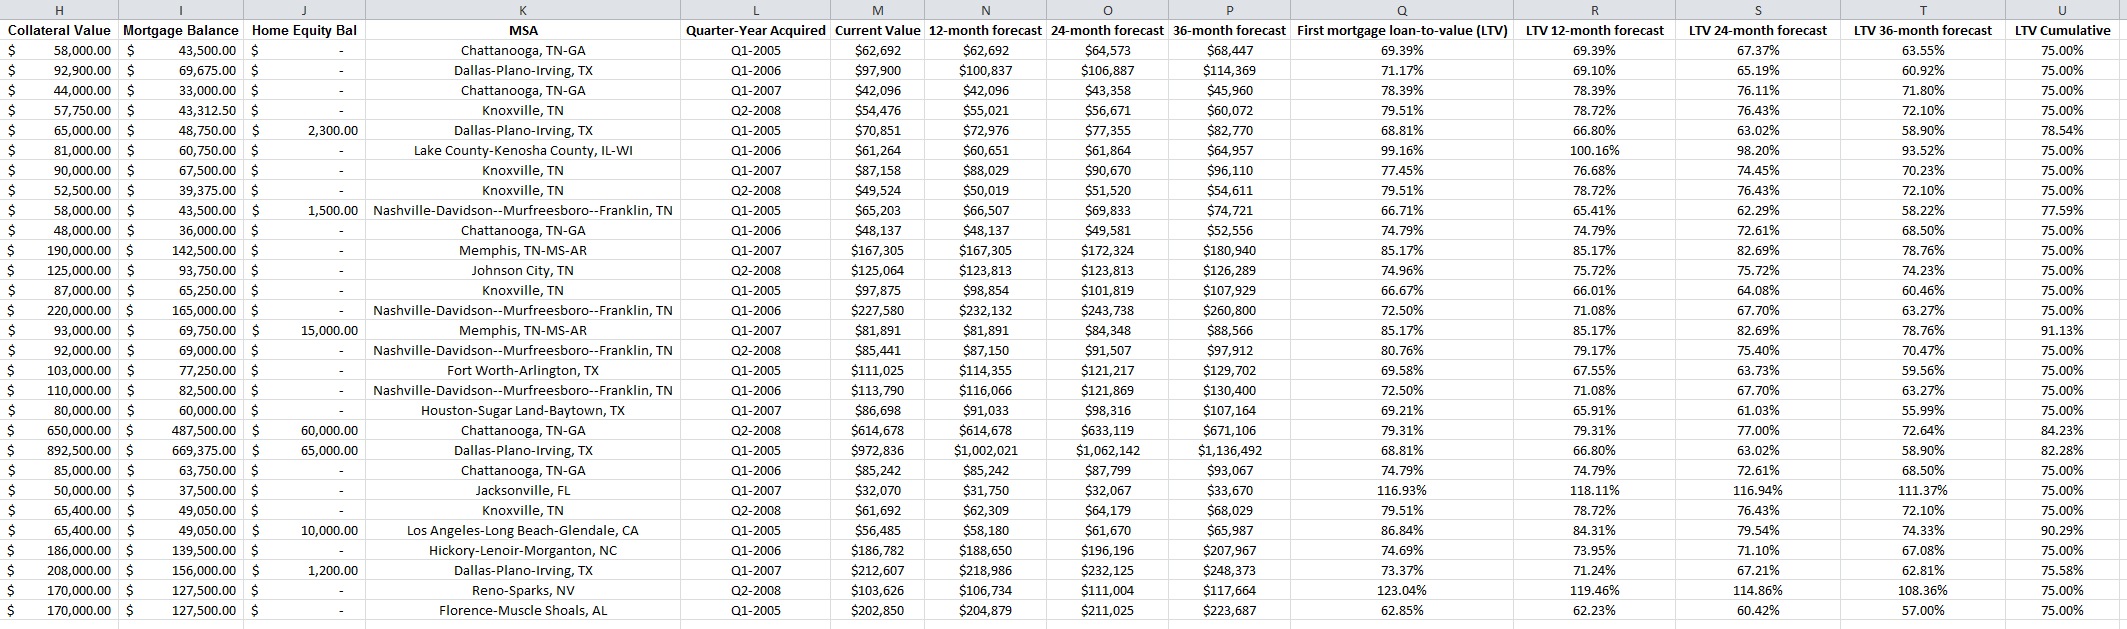 View sample results
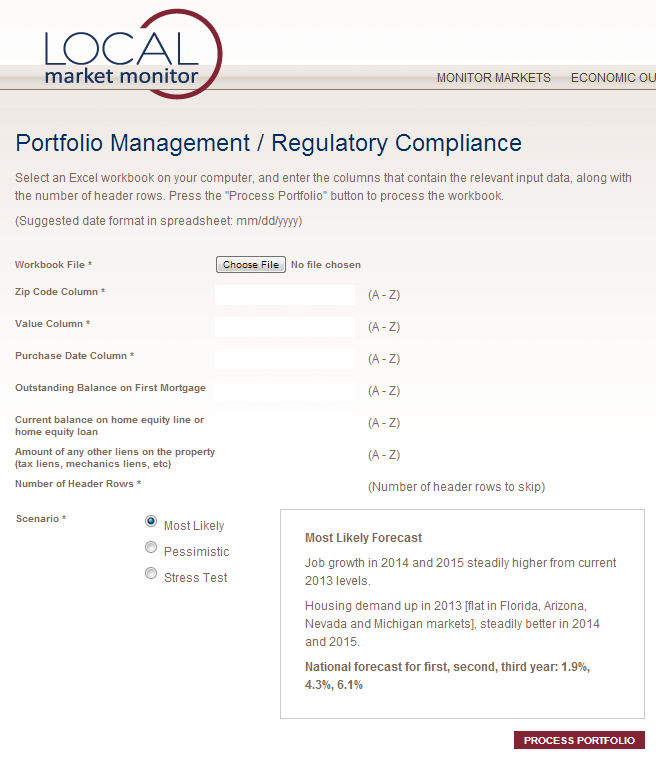 View a screenshot of the Portfolio Management / Regulatory Compliance page
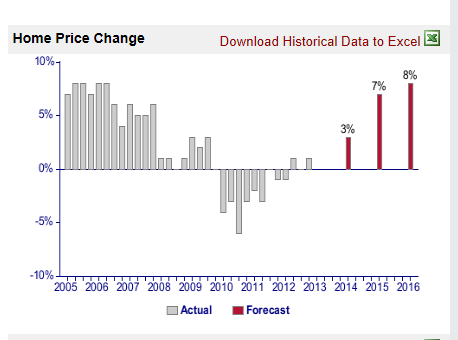 View a forecast chart for Corpus Christi, Texas.
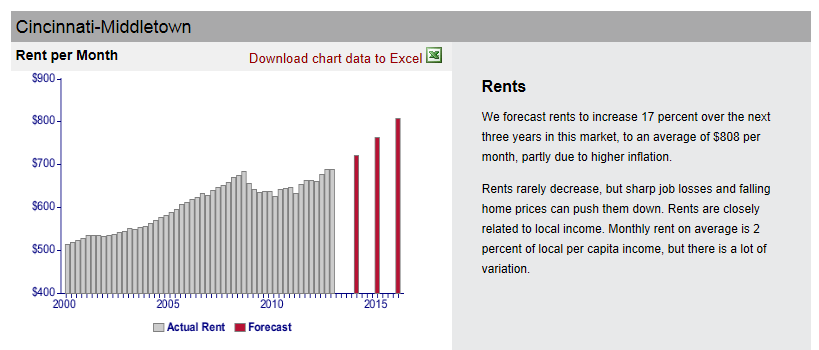 View a rent chart for Cincinnati, Ohio.
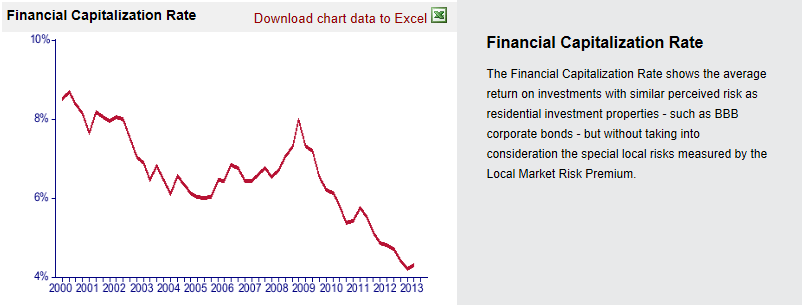 View a cap rate chart for Charleston, South Carolina.