|
|
Print to PDF | Last Update: 4/3/2024 |
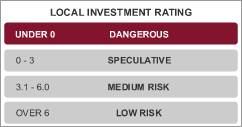
Historical Local Investment Ratings
![]()
| County | Year 1 | Year 2 | Year 3 |
|---|---|---|---|
| Wayne County MI | -2.0% | -2.9% | -1.9% |
| Download county forecasts | |||
April. The economy features large healthcare, business services and transport/warehouse sectors. Current JOB GROWTH is lower than the national average of 1.8 percent, little different than last quarter. Recent growth in business services was poor. Pre-pandemic job growth was poor. Effects of the pandemic still linger. In this market some covid jobs have not been recovered.
3-Year POPULATION GROWTH is -2.1 percent. Rents are high compared to home prices, presenting investment opportunities. 35 percent of housing is rented. Over the last 3 years, total income (a pressure on prices) grew 11 percent (US: 19%); HOME PRICES rose 32 percent, 7 percent in the past year. The market is now well overpriced. Expect softer prices in 2024. If the economy falters, home prices could drop 23 percent.
Download quarterly data to Excel